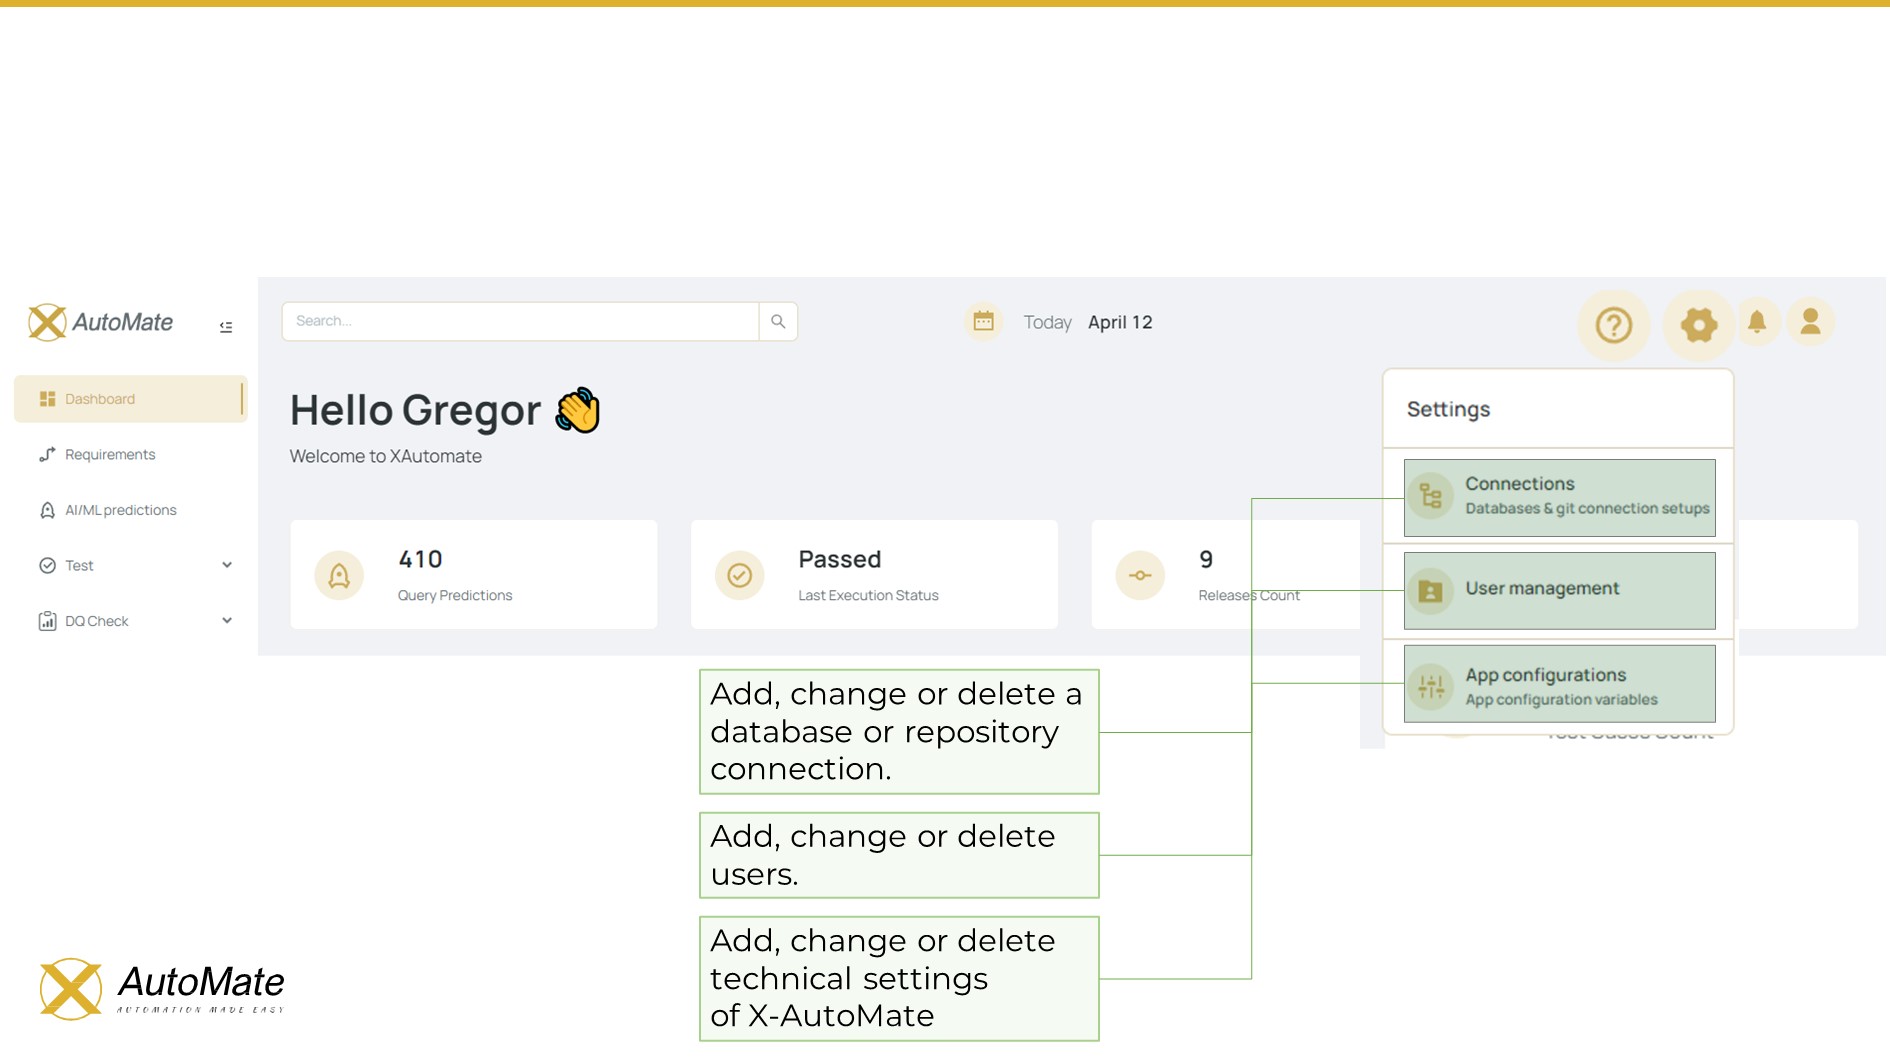
📊 Main Dashboard
🏠 Dashboard Menu
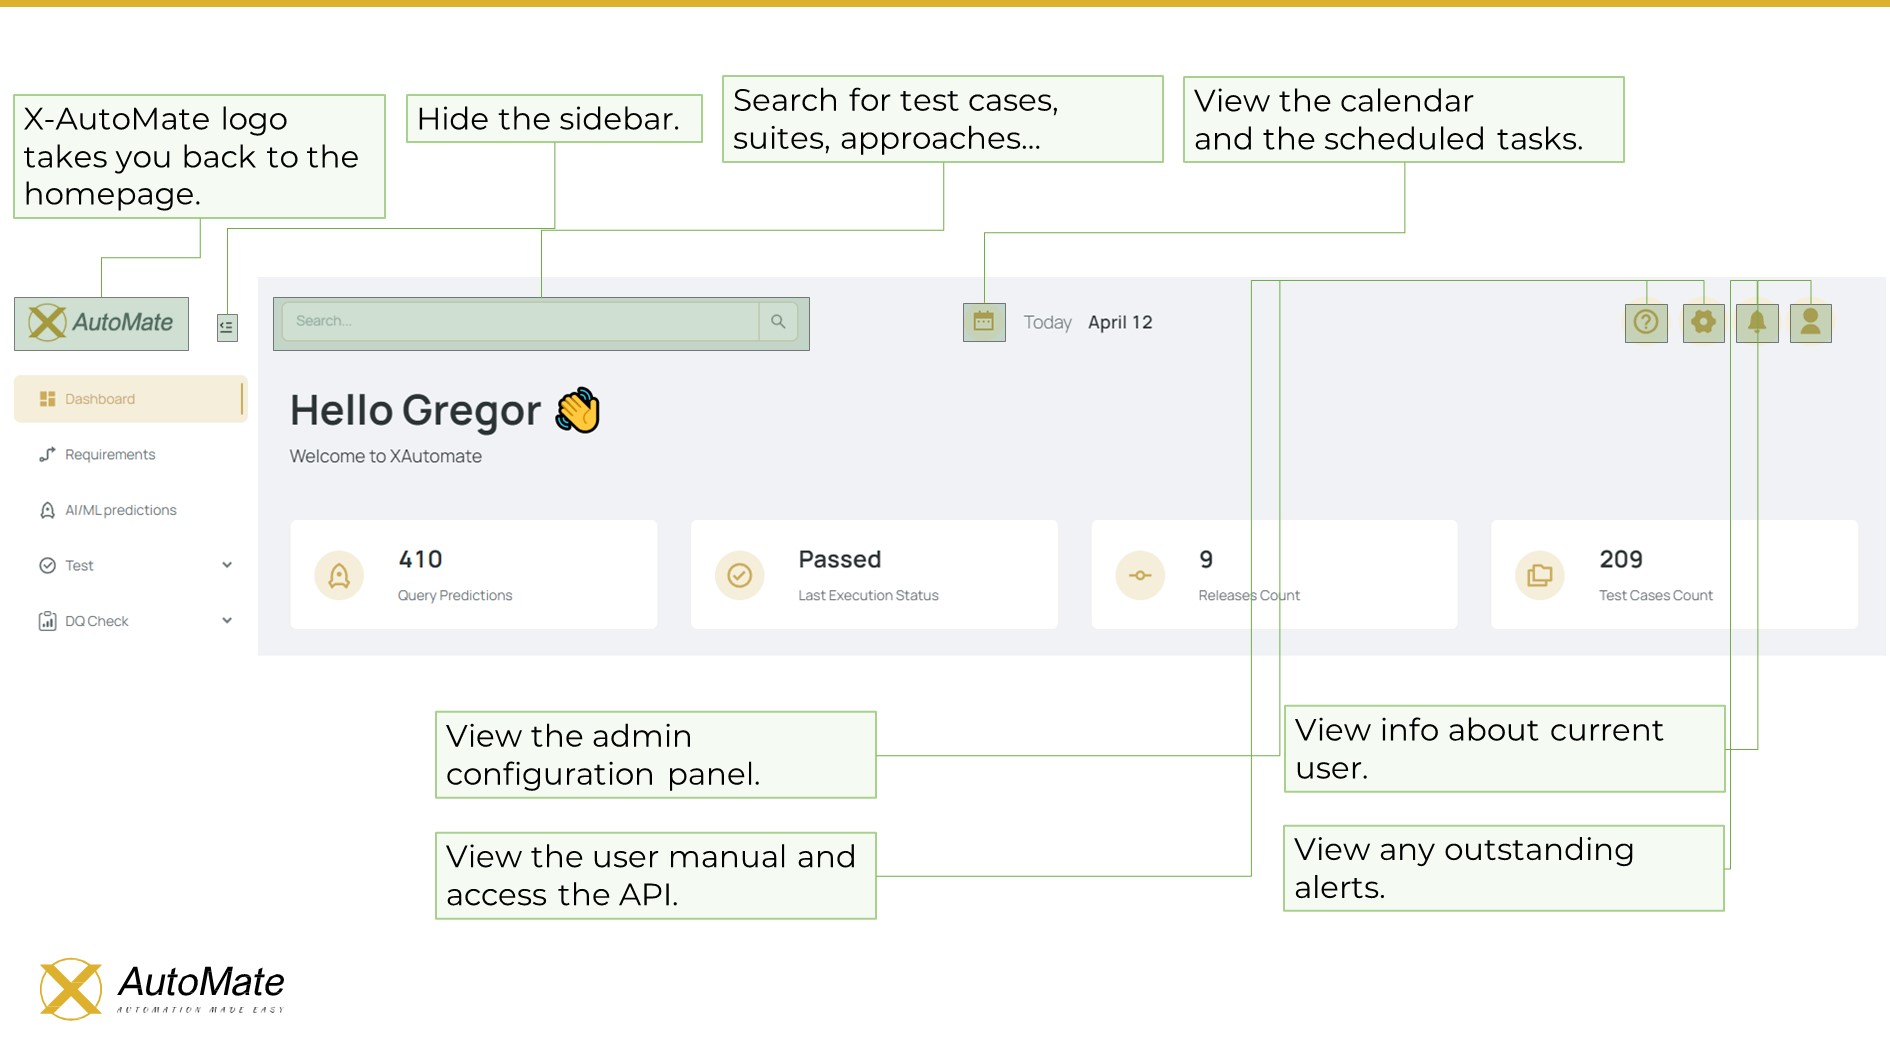
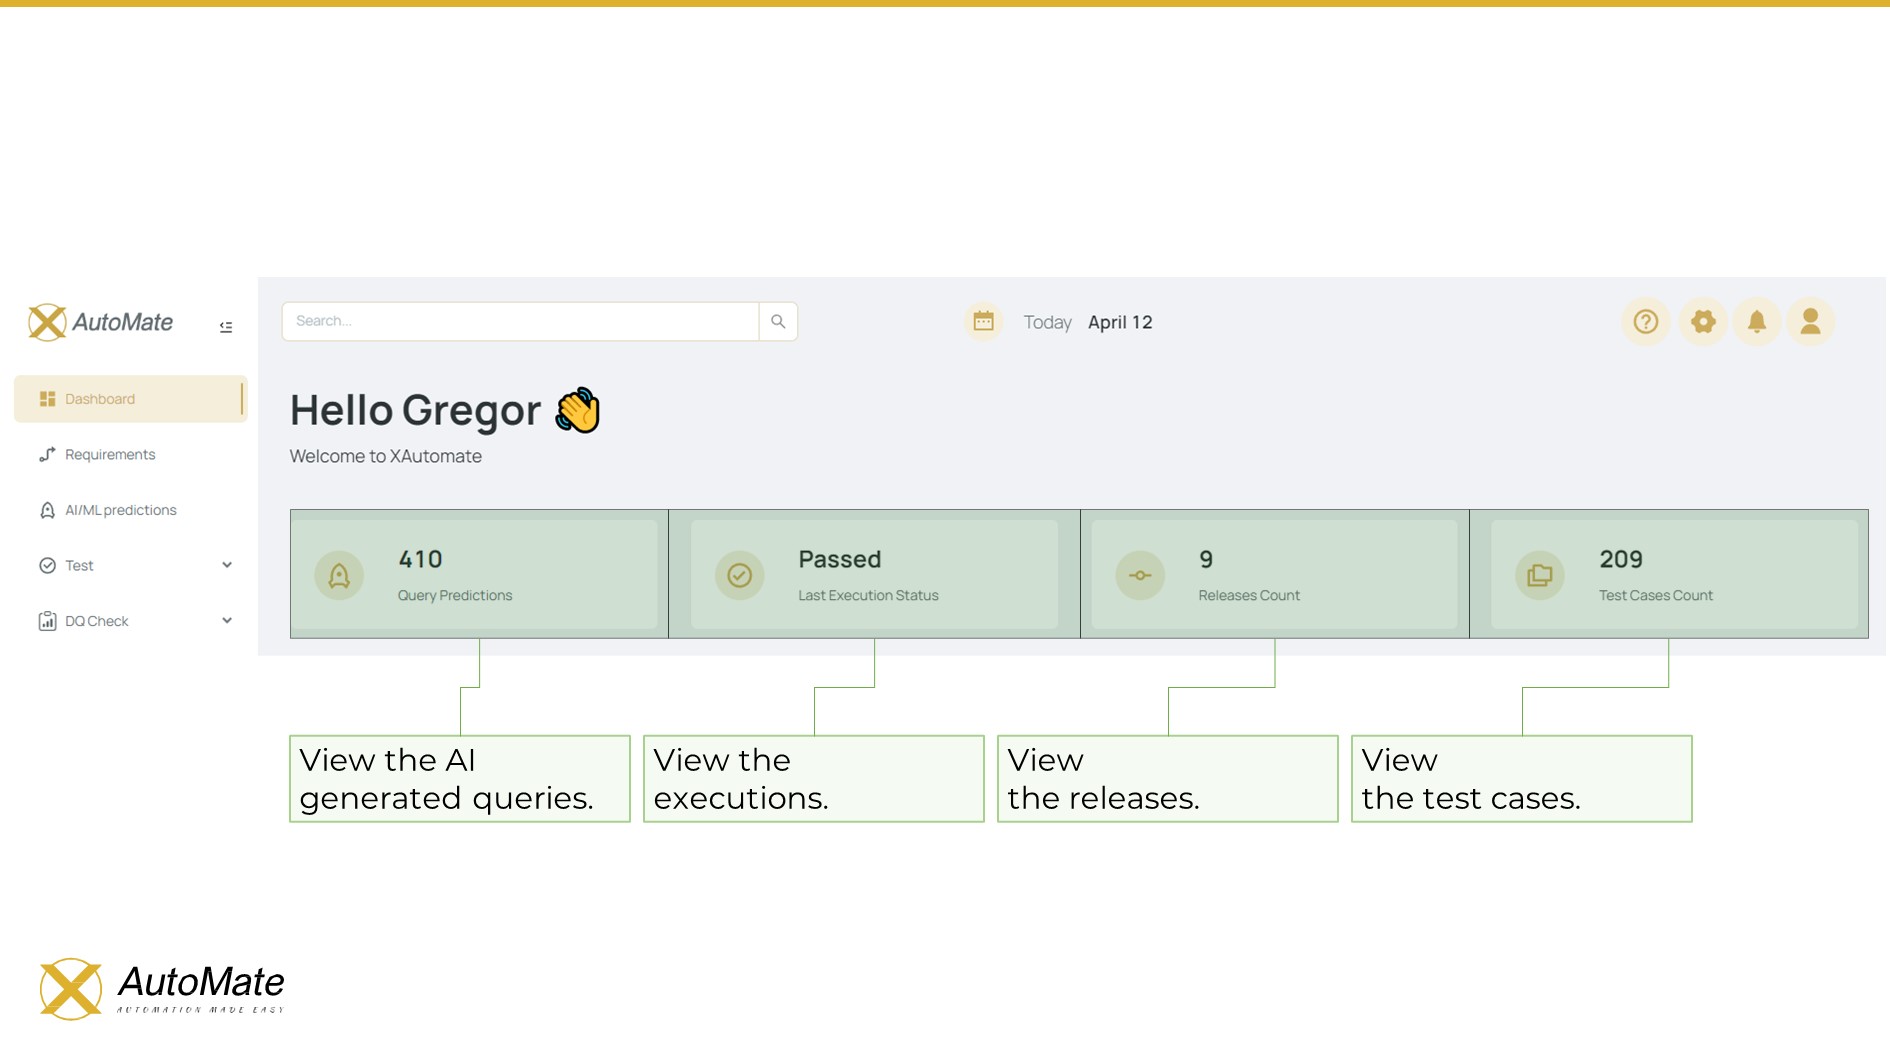
On the Dashboard of X-AutoMate, users are presented with various statistics on:
- ✅ Test Executions
- 🚀 Releases
- 📈 Test Coverage
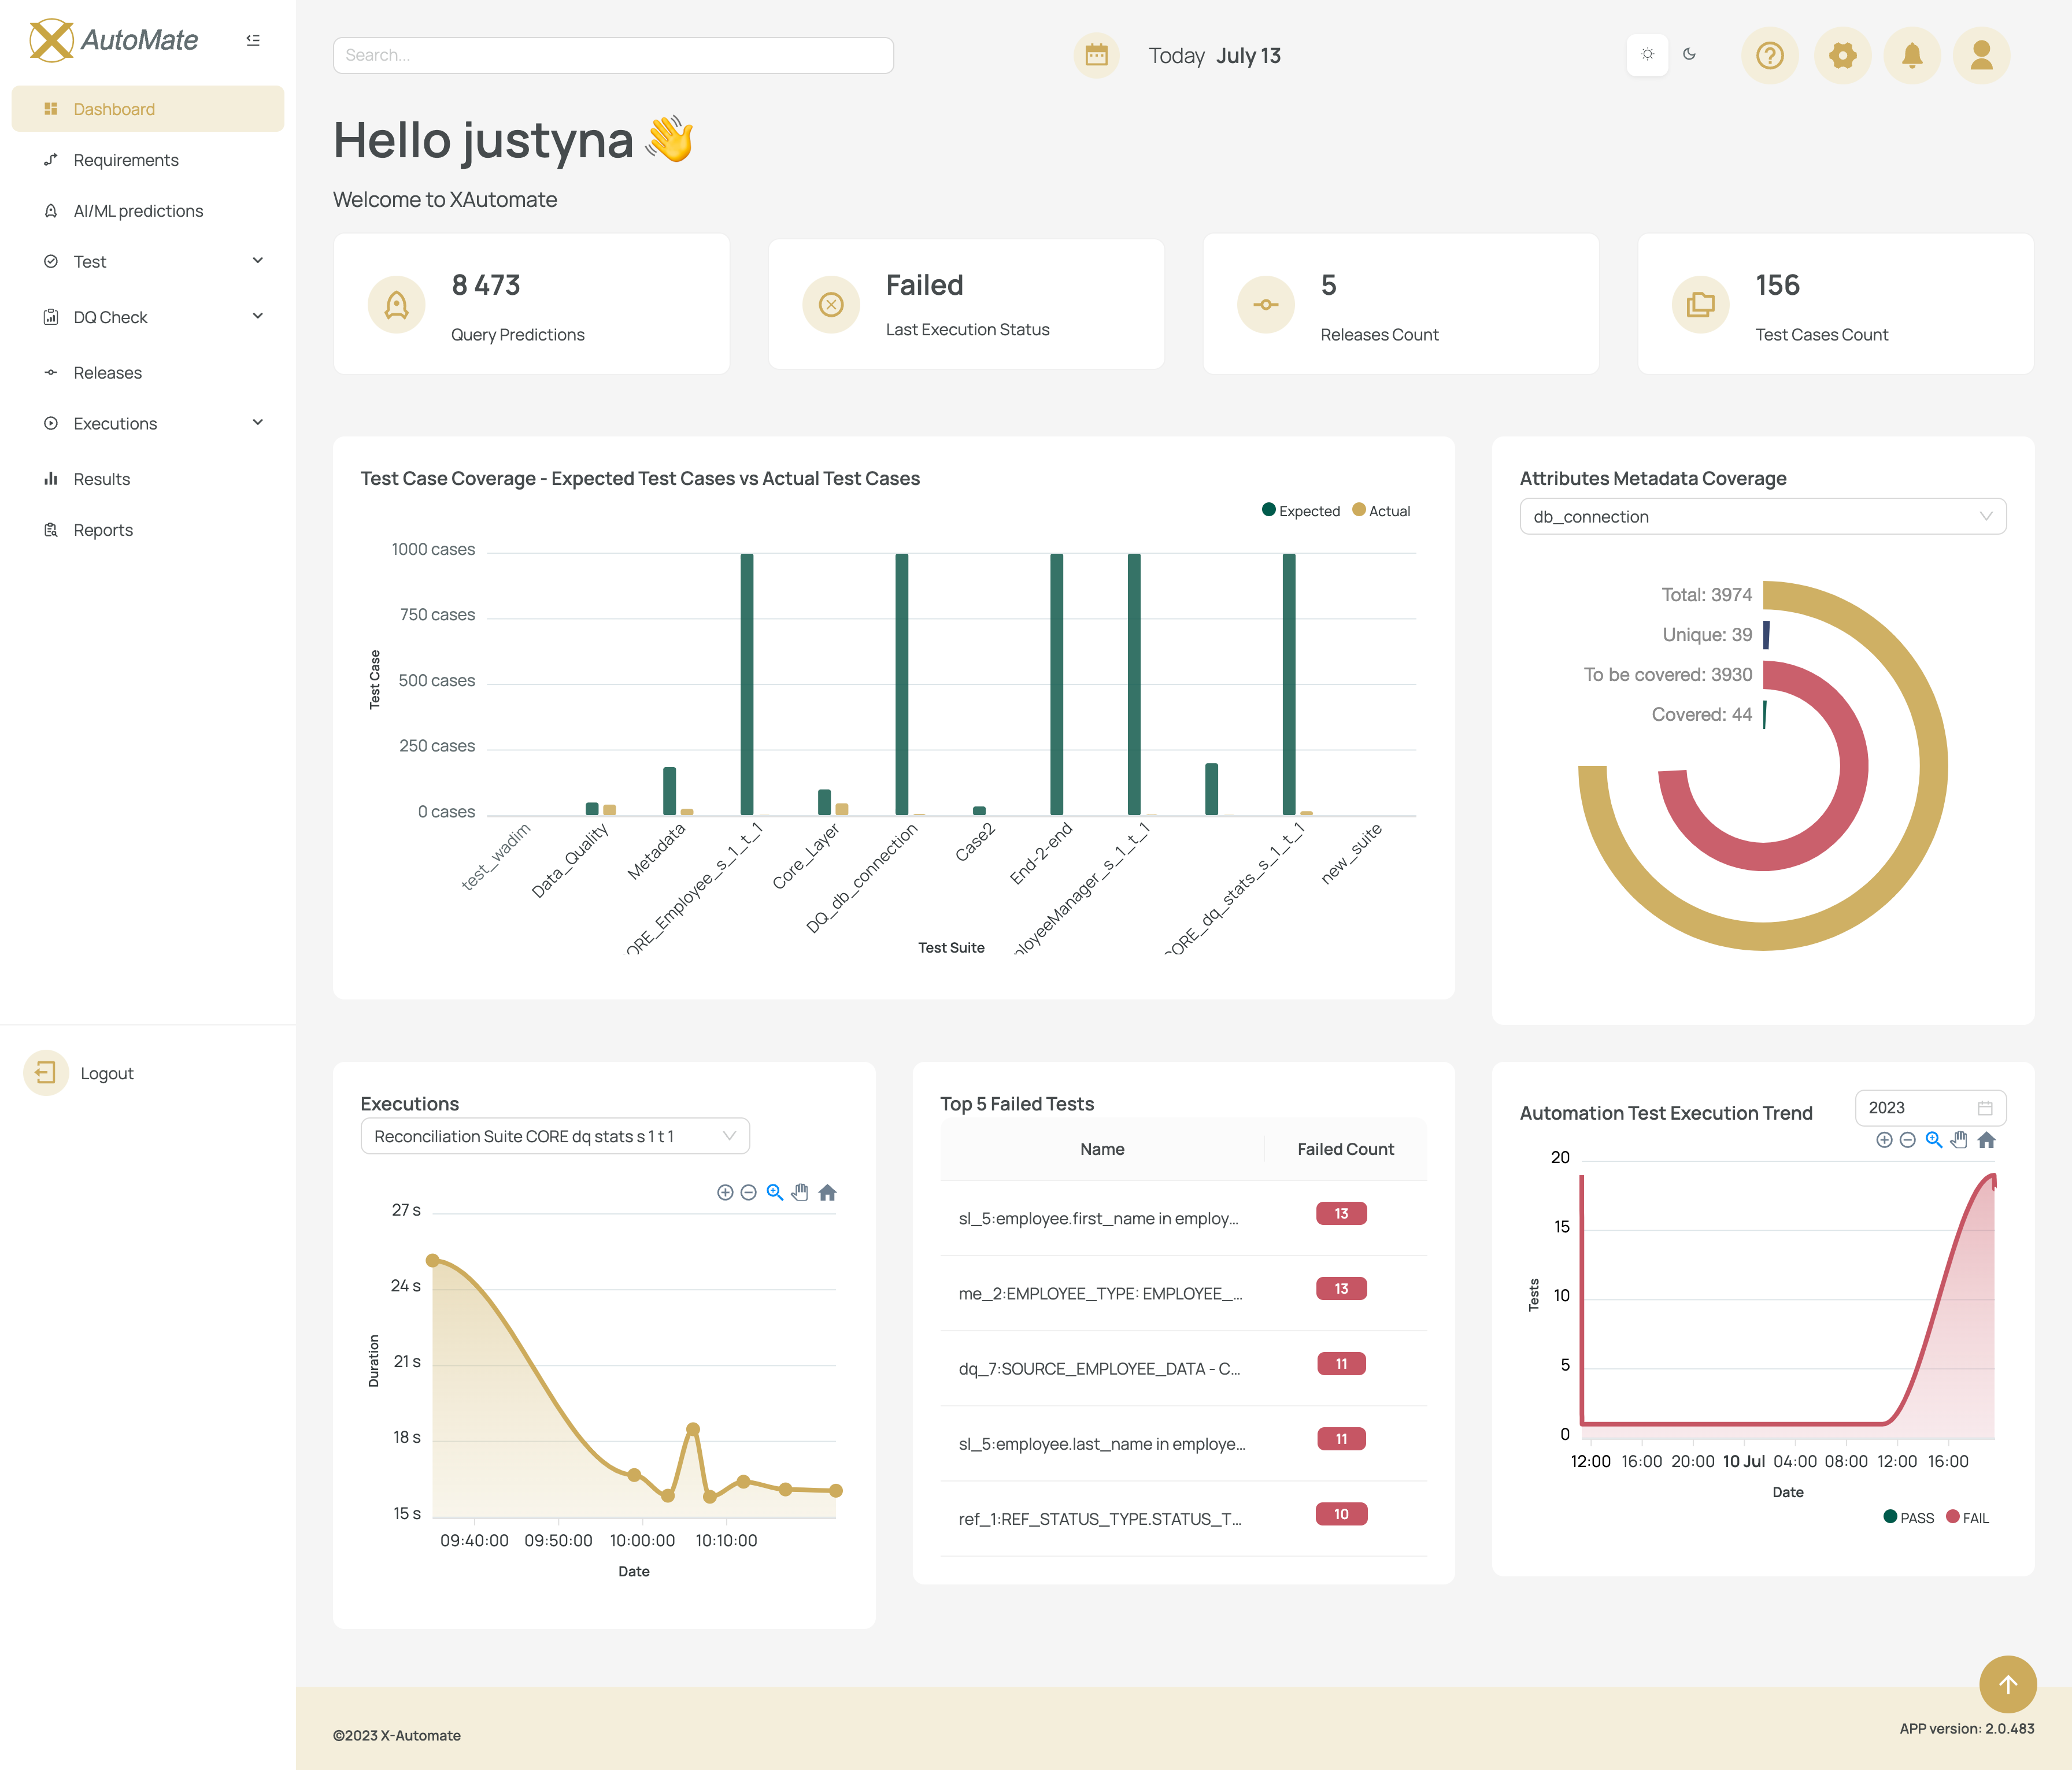
You can:
- 🖥️ Maximize the User Menu (main screen)
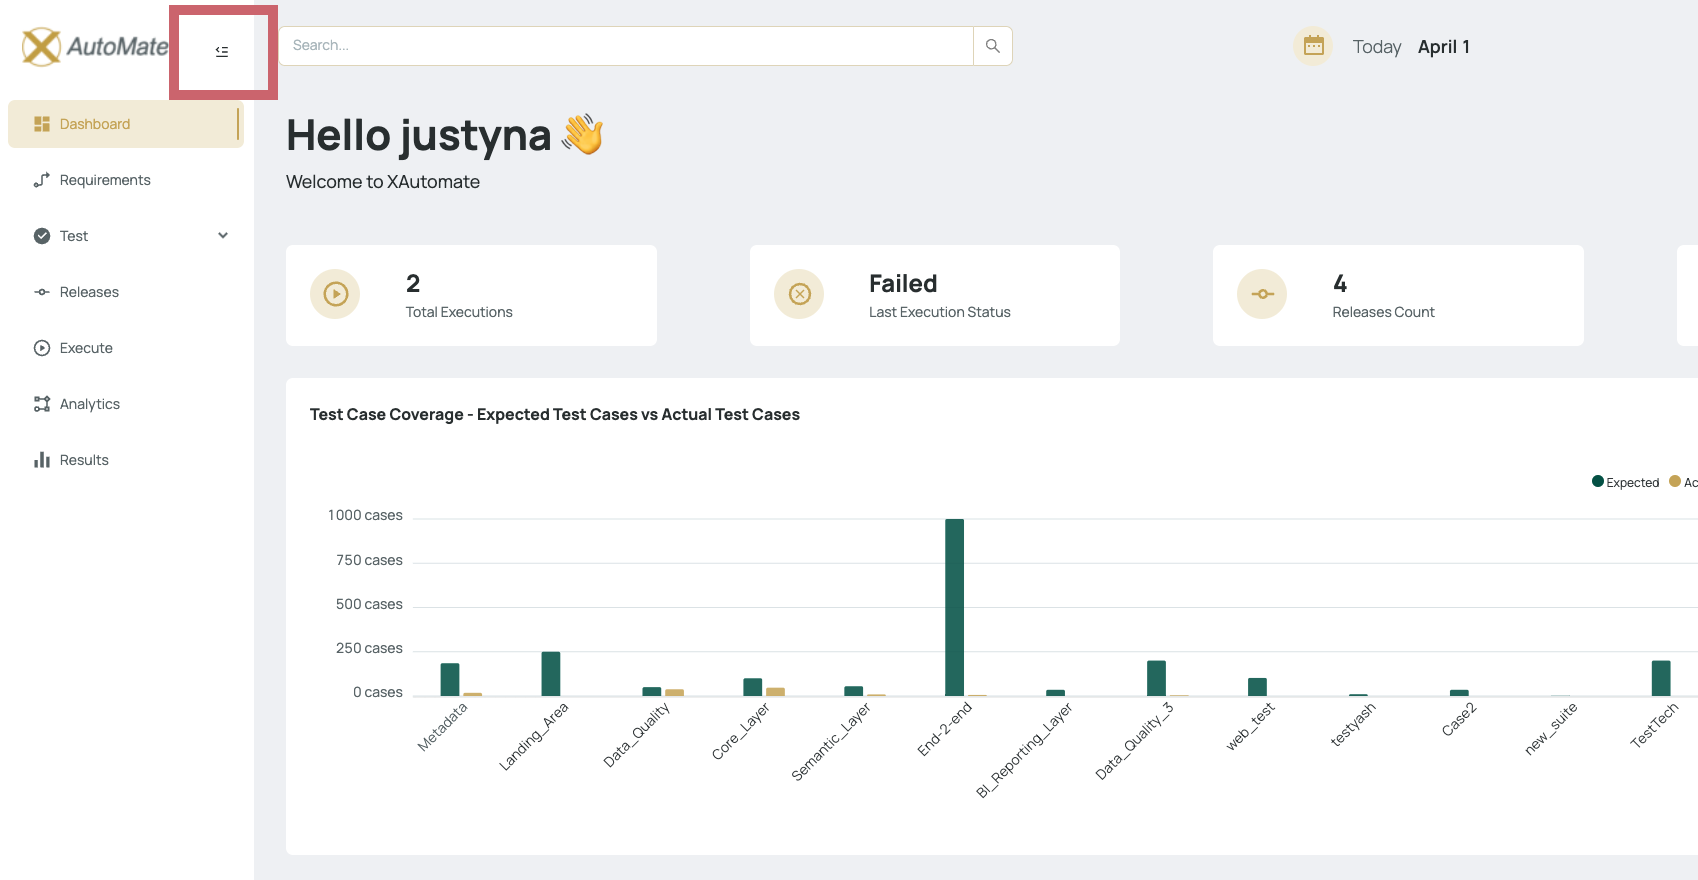
- 📂 Minimize the left-side navigation bar
This is done by clicking the toggle button at the top of the navigation panel, offering a cleaner and more focused workspace.
Clicking the X-AutoMate logo at any time will navigate you back to the Dashboard.
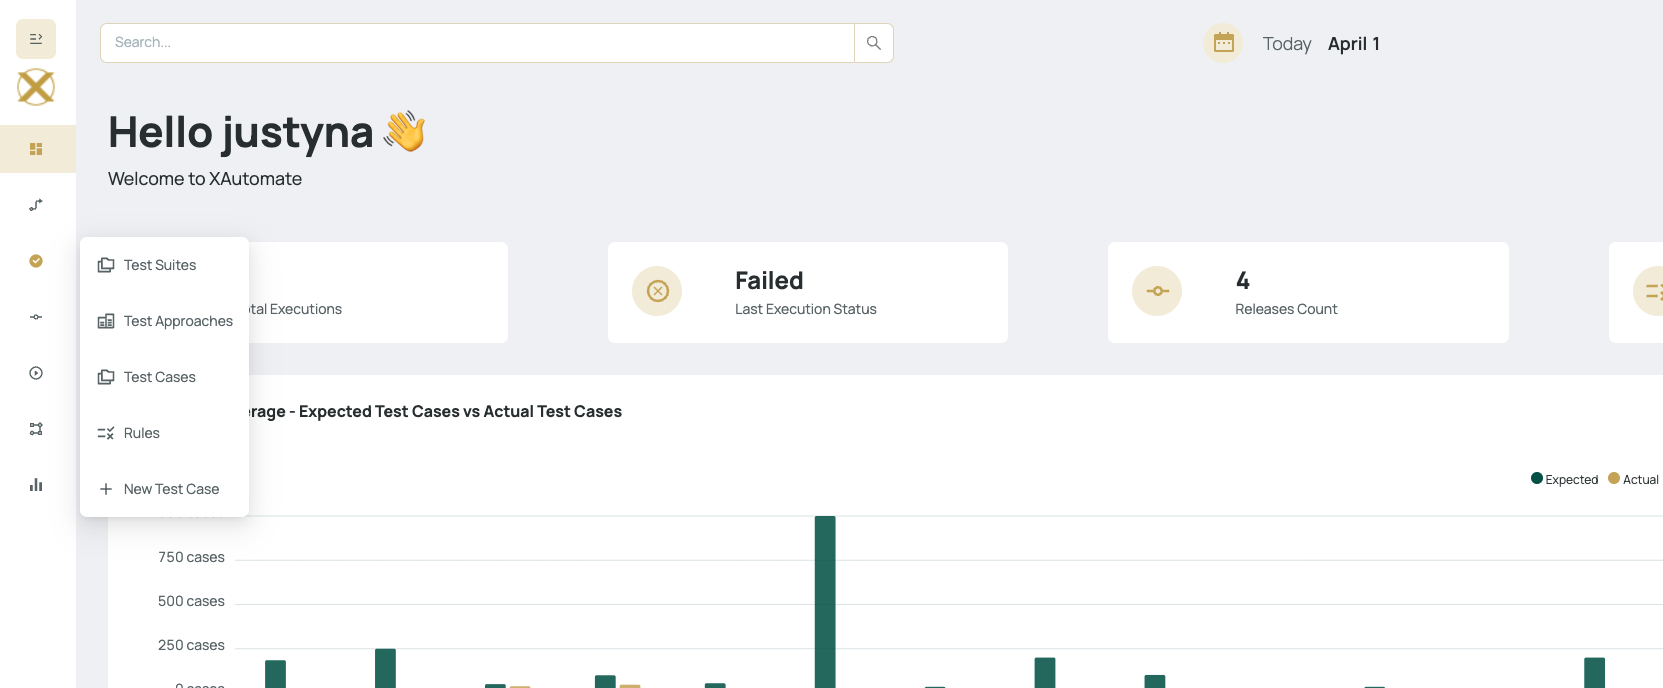
📐 Dashboard Details
The detailed Dashboard view includes:
- 📊 Extended metrics
- 📉 Charts and visualizations
- 📋 Status indicators
These provide deeper insights into the project’s test execution trends, health, and progress.
