🧾 Execution Results
The Results page in X-AutoMate lets you track the status, progress, and outcomes of all your executions — whether they are test runs, technical jobs, DAG workflows, or group executions.
📊 Overview
On the main Results page, you’ll see a real-time view of your executions along with key statistics.
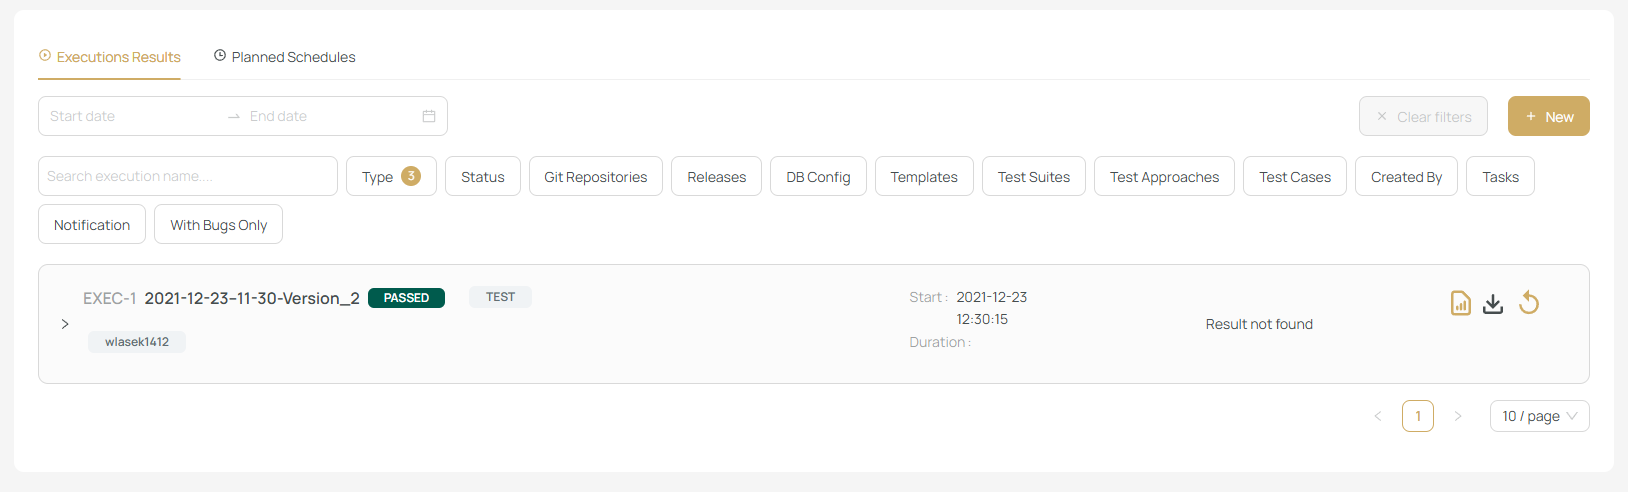
You can apply powerful filters to quickly find the executions you're interested in:
- Date range
- Execution type (Test, DAG, Technical, Group)
- Status (Running, Completed, Failed, etc.)
- Associated connections or Git repositories
- Related test suites, test cases, or requirements
These filters provide full visibility and control over your execution history.
🔍 Execution Details
Clicking on an execution row will expand it and show detailed information about the run.
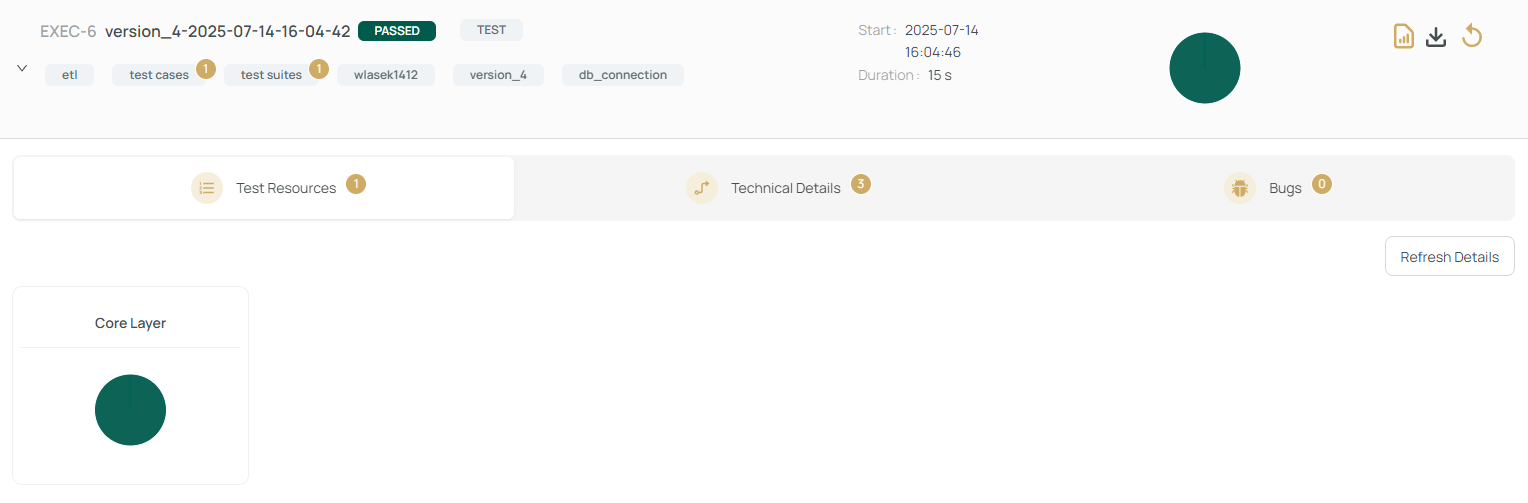
The expanded view includes 3 key tabs:
- Test Resources – View test cases, suites, DQ checks, and their results.
- Technical Details – Shows underlying system actions like metadata gathering, profiling, etc.
- Bugs – Displays linked or discovered bugs (if integrated with your bug tracker).
Use the refresh button to get the latest execution status.
📄 Viewing Logs and Reports
- Clicking on an individual test resource opens detailed logs (including full Robot Framework logs for custom tests).
- You can rerun the execution, download artifacts (e.g., logs, generated Robot files), or view a structured report once the execution is completed.
Test Plan
- For non ad-hoc release executions, a test plan is generated and registered in the requirements system.
🌐 DAG / Workflow Results
For DAG executions, the results screen will display the familiar graph-based designer view, where each node represents a task. Clicking a node will display its specific execution logs and outputs.
⚙️ Technical Executions
For technical executions (e.g., metadata collection, Git tests), only the Technical Details tab will be available — no test cases are involved.
🗓 Planned Schedules
Executions triggered via schedule can be found under the Planned Schedules tab.
👉 Learn more about scheduling on the Schedules page.
Use the Results page to ensure your testing workflows run as expected, stay informed about failures or bugs, and monitor the health of your data testing ecosystem.